As one of the largest web domains in Europe, maybe the world, BMJ is a highly accessed global healthcare knowledge provider. Their medical journals are the main entry point for readers worldwide. The company currently hosts 65 medical and allied science journals each with its website and infrastructure.
Our work with BMJ focuses on improving the current system’s page load, and accessibility and at the same time addressing the efficiency of adding new business requirements through a more robust delivery pipeline. With this goal in mind, we embarked on the journey to migrate their content, journal by journal, page by page, to a decoupled front-end platform built with Next.js. Until now, we’ve migrated all non-content pages and all the article pages for the BMJ Public Health journal.
While considering the performance constraints for the new platform, we decided to include Lighthouse in our development workflow, to measure the web vitals for our work constantly.
What is Lighthouse and how does it work?
Lighthouse, despite being a newcomer, has undergone substantial evolution since its 2016 inception. It began as an open-source Chrome extension that enabled developers to conduct audits within the Chrome browser. In 2018 it was integrated into Chrome DevTools for enhanced accessibility and user-friendliness. Today, Lighthouse is undergoing ongoing development where Google tirelessly updates it to align with changing web standards and best practices, adding new audits and features regularly. It’s regarded as a go-to tool in web development for creating technically solid and user-friendly websites.
“Lighthouse is an open-source, automated tool for improving the performance, quality, and correctness of your web apps.
When auditing a page, Lighthouse runs a barrage of tests against the page and then generates a report on how well the page did. From here you can use the failing tests as indicators of what you can do to improve your app.”
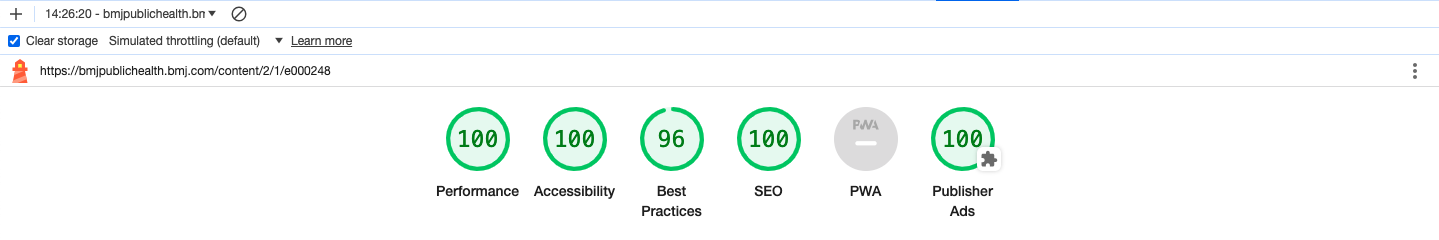
A Lighthouse performance check implies five audits: Performance, Accessibility, Best Practices, SEO, and Progressive Web App (PWA). Out of these five, we decided to focus on the first four only, PWA not being a target for the work we did on the websites. In addition to these four, we also looked at the Publisher Ads which served as an indicator of the implementation of the ads on our pages. The original implementation on the platform met the specified requirements, so no improvements were necessary except for addressing the Cumulative Layout Shift, which is discussed later in this article.
As we mentioned in the previous article, we managed to get scores of 100 for all four audits that we monitored, which is a remarkable performance in itself. Let’s dive into the work that we’ve done specifically for this to happen.
Performance audit
For us, the Performance audit was and continues to be vital. Each new feature we add to the webpage is analyzed against five key metrics: First Contentful Paint, Speed Index, Largest Contentful Paint, Total Blocking Time, and Cumulative Layout Shift.
Before we start looking at specific actions that we took to improve these metrics, we need to mention that most third-party scripts like cookie consent, marketing pop-ups injected through Google Tag Manager, and chatbots are affecting the performance of any website, and there’s very little you can do to control this. To measure the areas that are in our control, we ran the Lighthouse audits on staging versions that do not have these third-party scripts, and it’s in this environment we got those 100 scores, on the desktop version.
Even though we obtained these perfect scores, the third-party scripts problem was still something that impacted the end user. To address this, we troubleshoot some of them, and we asked their providers to help us by fixing some of the issues present in their scripts.
Most of the metrics in this audit are impacted by the size of the files reaching the users’ browsers. That’s why it is important to keep these sizes to a minimum. Fortunately, we are using Next.js which does a lot of heavy lifting for us in optimizing the payloads sent to the clients. In addition to this, most of our pages consist of React Server Components which have the benefit of lowering the Javascript bundles. This has a direct impact on the Speed Index and the Total Blocking Time metrics; the smaller the Javascript bundles, the better these scores could be.
It’s also worth mentioning that the user’s internet connection plays an important role in the whole experience; a smaller Javascript bundle can be transported and executed faster on the user’s browser.
If the Speed Index seems pretty straightforward, it’s not the case for the First Contentful Paint. This indicator measures the time from when the user first navigates to the page to when any part of the page's content is rendered on the screen, content meaning mostly text and images. The difficulty of improving this metric comes from the variety of factors that can affect it. However, addressing them one by one makes a difference. While some are already handled by Next.js and the use of React Server Components, others require closer attention.
A goal we had for this audit was CSS minification, for which we decided to try TailwindCSS instead of the CSS in JS we had previously used. Both solutions minimize the CSS output, but TailwindCSS has the advantage of purging the CSS instructions not being used on the page, delivering only what’s needed for a specific page, thus keeping the CSS file size to a minimum.
Another key action we took was adding preconnection instructions for third-party script origins being loaded on our pages. This instructs the browser to start establishing connections to the specified origins, limiting the time spent waiting when the request is made.
In terms of caching, the content we use to create pages is mostly static and this permits us to leverage the caching layers that Next.js and Vercel are providing, ensuring that our pages are as fast as possible. But between the data caching layer in Next.js and the full route cache in the Vercel CDN, lies our page processing. In this processing step, we converted the HTML that we received from our API, which was structured on the old design, to React components. The output of this process needed to match the new design, and for this, we needed to remove some elements, change others, and extract data to power the sidebar. Parsing can be a slow process and considering that an article can have a lot of DOM nodes, we tailored the process to have a minimum number of passes through the DOM, more specifically just one pass. This was possible due to the way the html-react-parser lets us replace the HTML elements with React components.
As you can see, optimizing a page for a good First Contentful Paint score requires actions across the whole system to ensure that, in the end, the user experience is the best. And speaking of user experience, the Cumulative Layout Shift also plays an important role in it. Nobody likes it when the text starts shifting because the ads start loading. To avoid this, we ensured that all the images had a set width and height and that the ads were loaded in a specific, fixed-sized container.
Accessibility audit
After achieving a 100 score for the Performance audit, the next important audit that we had to tackle was Accessibility.
BMJ is a pioneering publisher and champion of open-access research. Accessibility is a key part of this. To ensure that the new article page is accessible, we monitored the Accessibility audit report that Lighthouse produces and corrected all the issues that might have arisen during development.
The key elements to successfully navigating this audit were:
- providing text for the image alt attributes
- enabling extensive keyboard navigation through the page, as well as for tables and image pop-ups
- providing role properties for key elements on the page
- respecting the headings levels
Another important element that we needed to respect was the color contrast, for which we had to collaborate with our team’s UX/UI designer to find a proper color scheme. Also, to cover the cases where screen readers are used, we rebuilt some of our key in-house components with shadcn/ui which has provided screen reader support.
Best Practices audit
For the Best Practices audit, most requirements were already handled by Next.js and by our use of Vercel for deployments. Using HTTPS has become much more common in recent years, but it’s still important to check for it.
The main improvement we did for this audit was to serve the images through a CDN, for which we used Cloudflare in combination with a Cloudflare Worker to proxy the article images from the Content Pipeline infrastructure. In terms of managing images, there are several improvements we’re planning to make soon, to enhance the reader’s experience further.
SEO audit
Search engines are a major source of traffic for BMJ Journals' article pages and we needed to ensure that we don’t generate critical SEO errors when migrating to the new platform. Luckily, the Next.js app router provides a simple enough way to generate all the metadata needed for the pages. Being a scholarly journal, we also had to provide meta tags using scholarly established standards like Dublin Core and Schema.org.
Monitoring the audits
Our delivery process ensures that we are constantly looking at the reports generated by Lighthouse to catch any issues that can come up in development early on. However, we’ve also created a second checkpoint by integrating Lighthouse audits into our CI/CD pipeline. Integrating Lighthouse with CI/CD through GitHub Actions helps us identify issues early, reducing the time and resources spent on fixing problems after deployment. Our team is instantly warned if one of our preview deployments is going under the threshold that we set for the metric scores.
If you’re interested in setting up Lighthouse Github Actions for your CI/CD pipeline, you can find more details here, including a list of recipes for different use cases, such as:
- Runing Lighthouse and validating against Lighthouse CI assertions.
- Uploading results to a private LHCI server.
- Auditing with custom Chrome options and custom Lighthouse config.
- Testing a static site without having to deploy it.
- Integrating Lighthouse CI with Netlify
- Using URL interpolation to pass secrets or environment variables
- Using a Lighthouse plugin.
- Using output for a powerful composition with other actions
- GitHub Action workflow on self-hosted GitHub runner (e.g. on-premise)
- Dynamically generating URLs
Conclusion
Unsurprisingly, there’s no secret recipe to hitting 100 scores for all the audits. It’s just a matter of patience and hard work going through all the improvements proposed by Lighthouse. What worked for this project might not work for yours. Depending on the frameworks and technologies used, some of the proposed items in this article can apply to different degrees.
The next article we plan to share here will detail the technical foundation behind our progress. Moving from theory to practice in our collaboration with BMJ, we will explore the architectural choices that enabled efficient content migration and helped us meet our performance objectives.